
Double-dip Arctic Oscillation
In February, Arctic sea ice extent continued to track below the average, and near the levels observed for February 2007. Ice extent was unusually low in the Atlantic sector of the Arctic, and above normal in the Bering Sea. Meanwhile, Antarctic sea ice reached its summer minimum, near the average for 1979 to 2000.
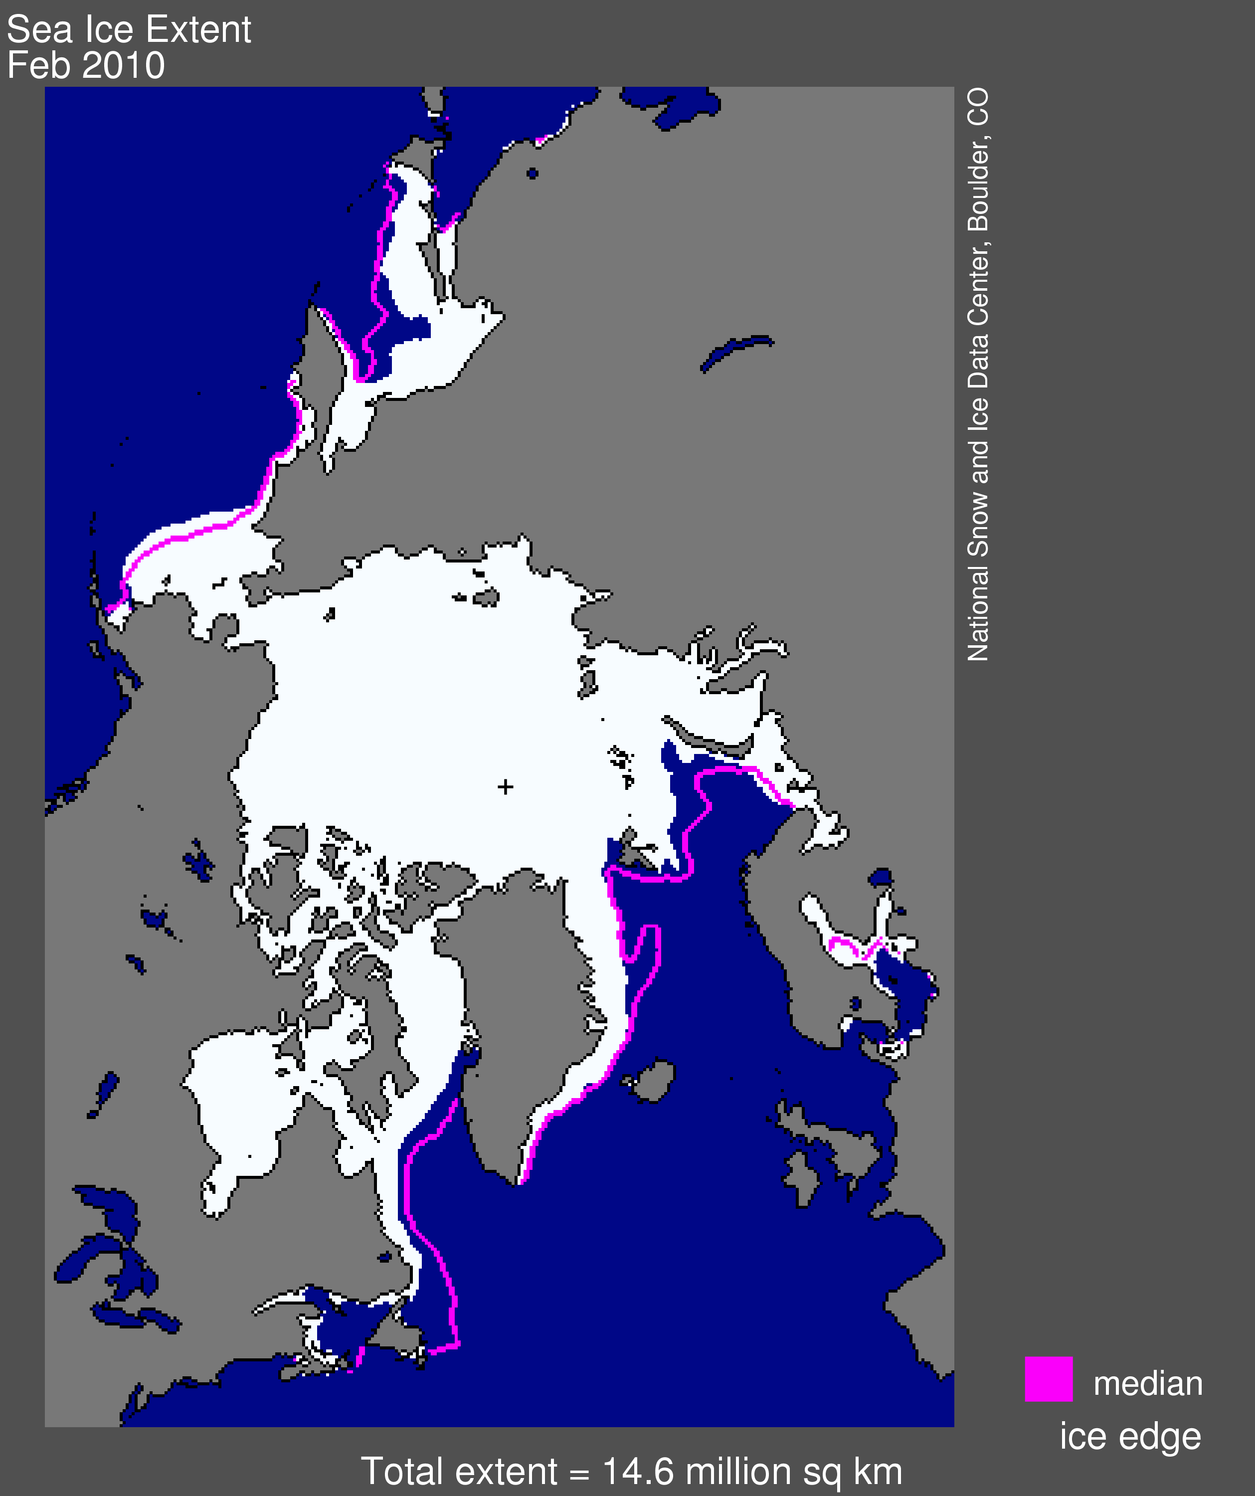 Figure 1. Arctic sea ice extent for February 2010 was 14.58 million square kilometers (5.63 million square miles). The magenta line shows the 1979 to 2000 median extent for that month. The black cross indicates the geographic North Pole. Sea Ice Index data. About the data.
 —Credit: National Snow and Ice Data Center
High-resolution image
Overview of conditions
Arctic sea ice extent averaged for February 2010 was 14.58 million square kilometers (5.63 million square miles). This was 1.06 million square kilometers (409,000 square miles) below the 1979 to 2000 average for February, but 220,000 square kilometers (85,000 square miles) above the record low for the month, which occurred in February 2005.
Ice extent was above normal in the Bering Sea, but remained below normal over much of the Atlantic sector of the Arctic, including the Barents Sea, part of the East Greenland Sea, and in the Davis Strait.
[...]
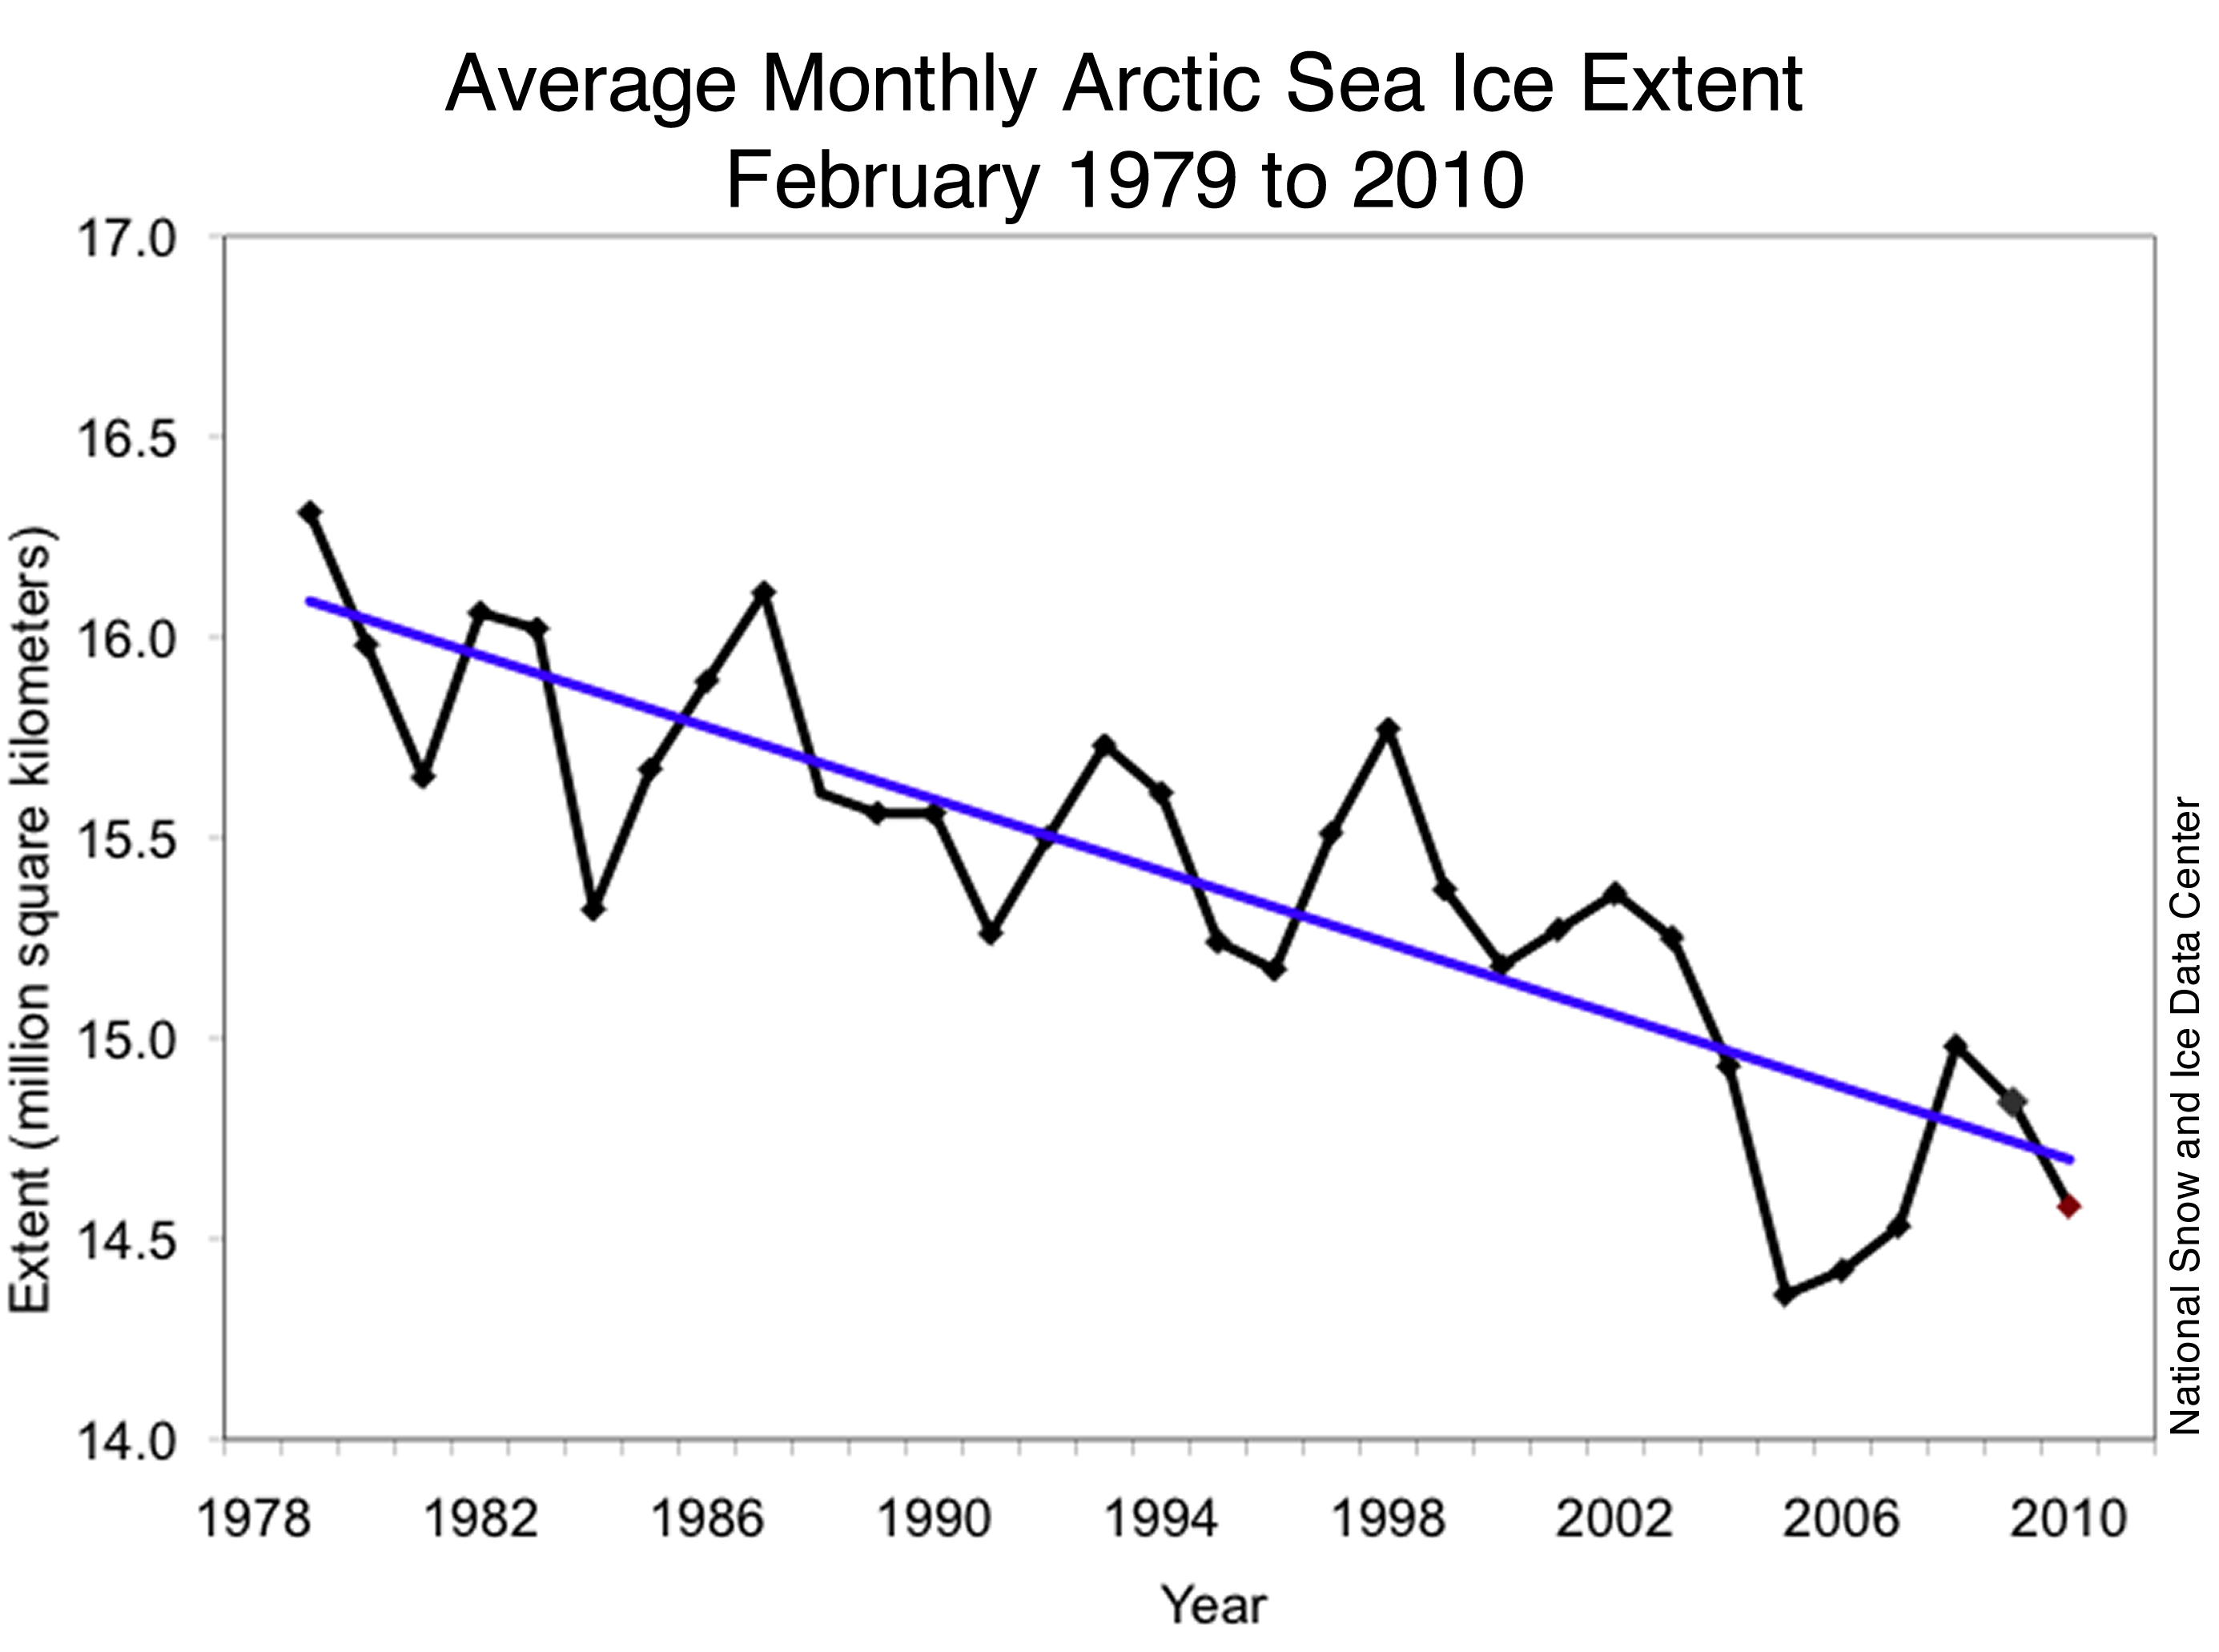 Figure 3. Monthly February ice extent for 1979 to 2010 shows a decline of 2.9% per decade.
 —Credit: National Snow and Ice Data Center
High-resolution image
February 2010 compared to past years
The average ice extent for February 2010 was the fourth lowest February extent since the beginning of the modern satellite record. It was 220,000 square kilometers (85,000 square miles) higher than the record low for February, observed in 2005. The linear rate of decline for February is now 2.9% per decade.
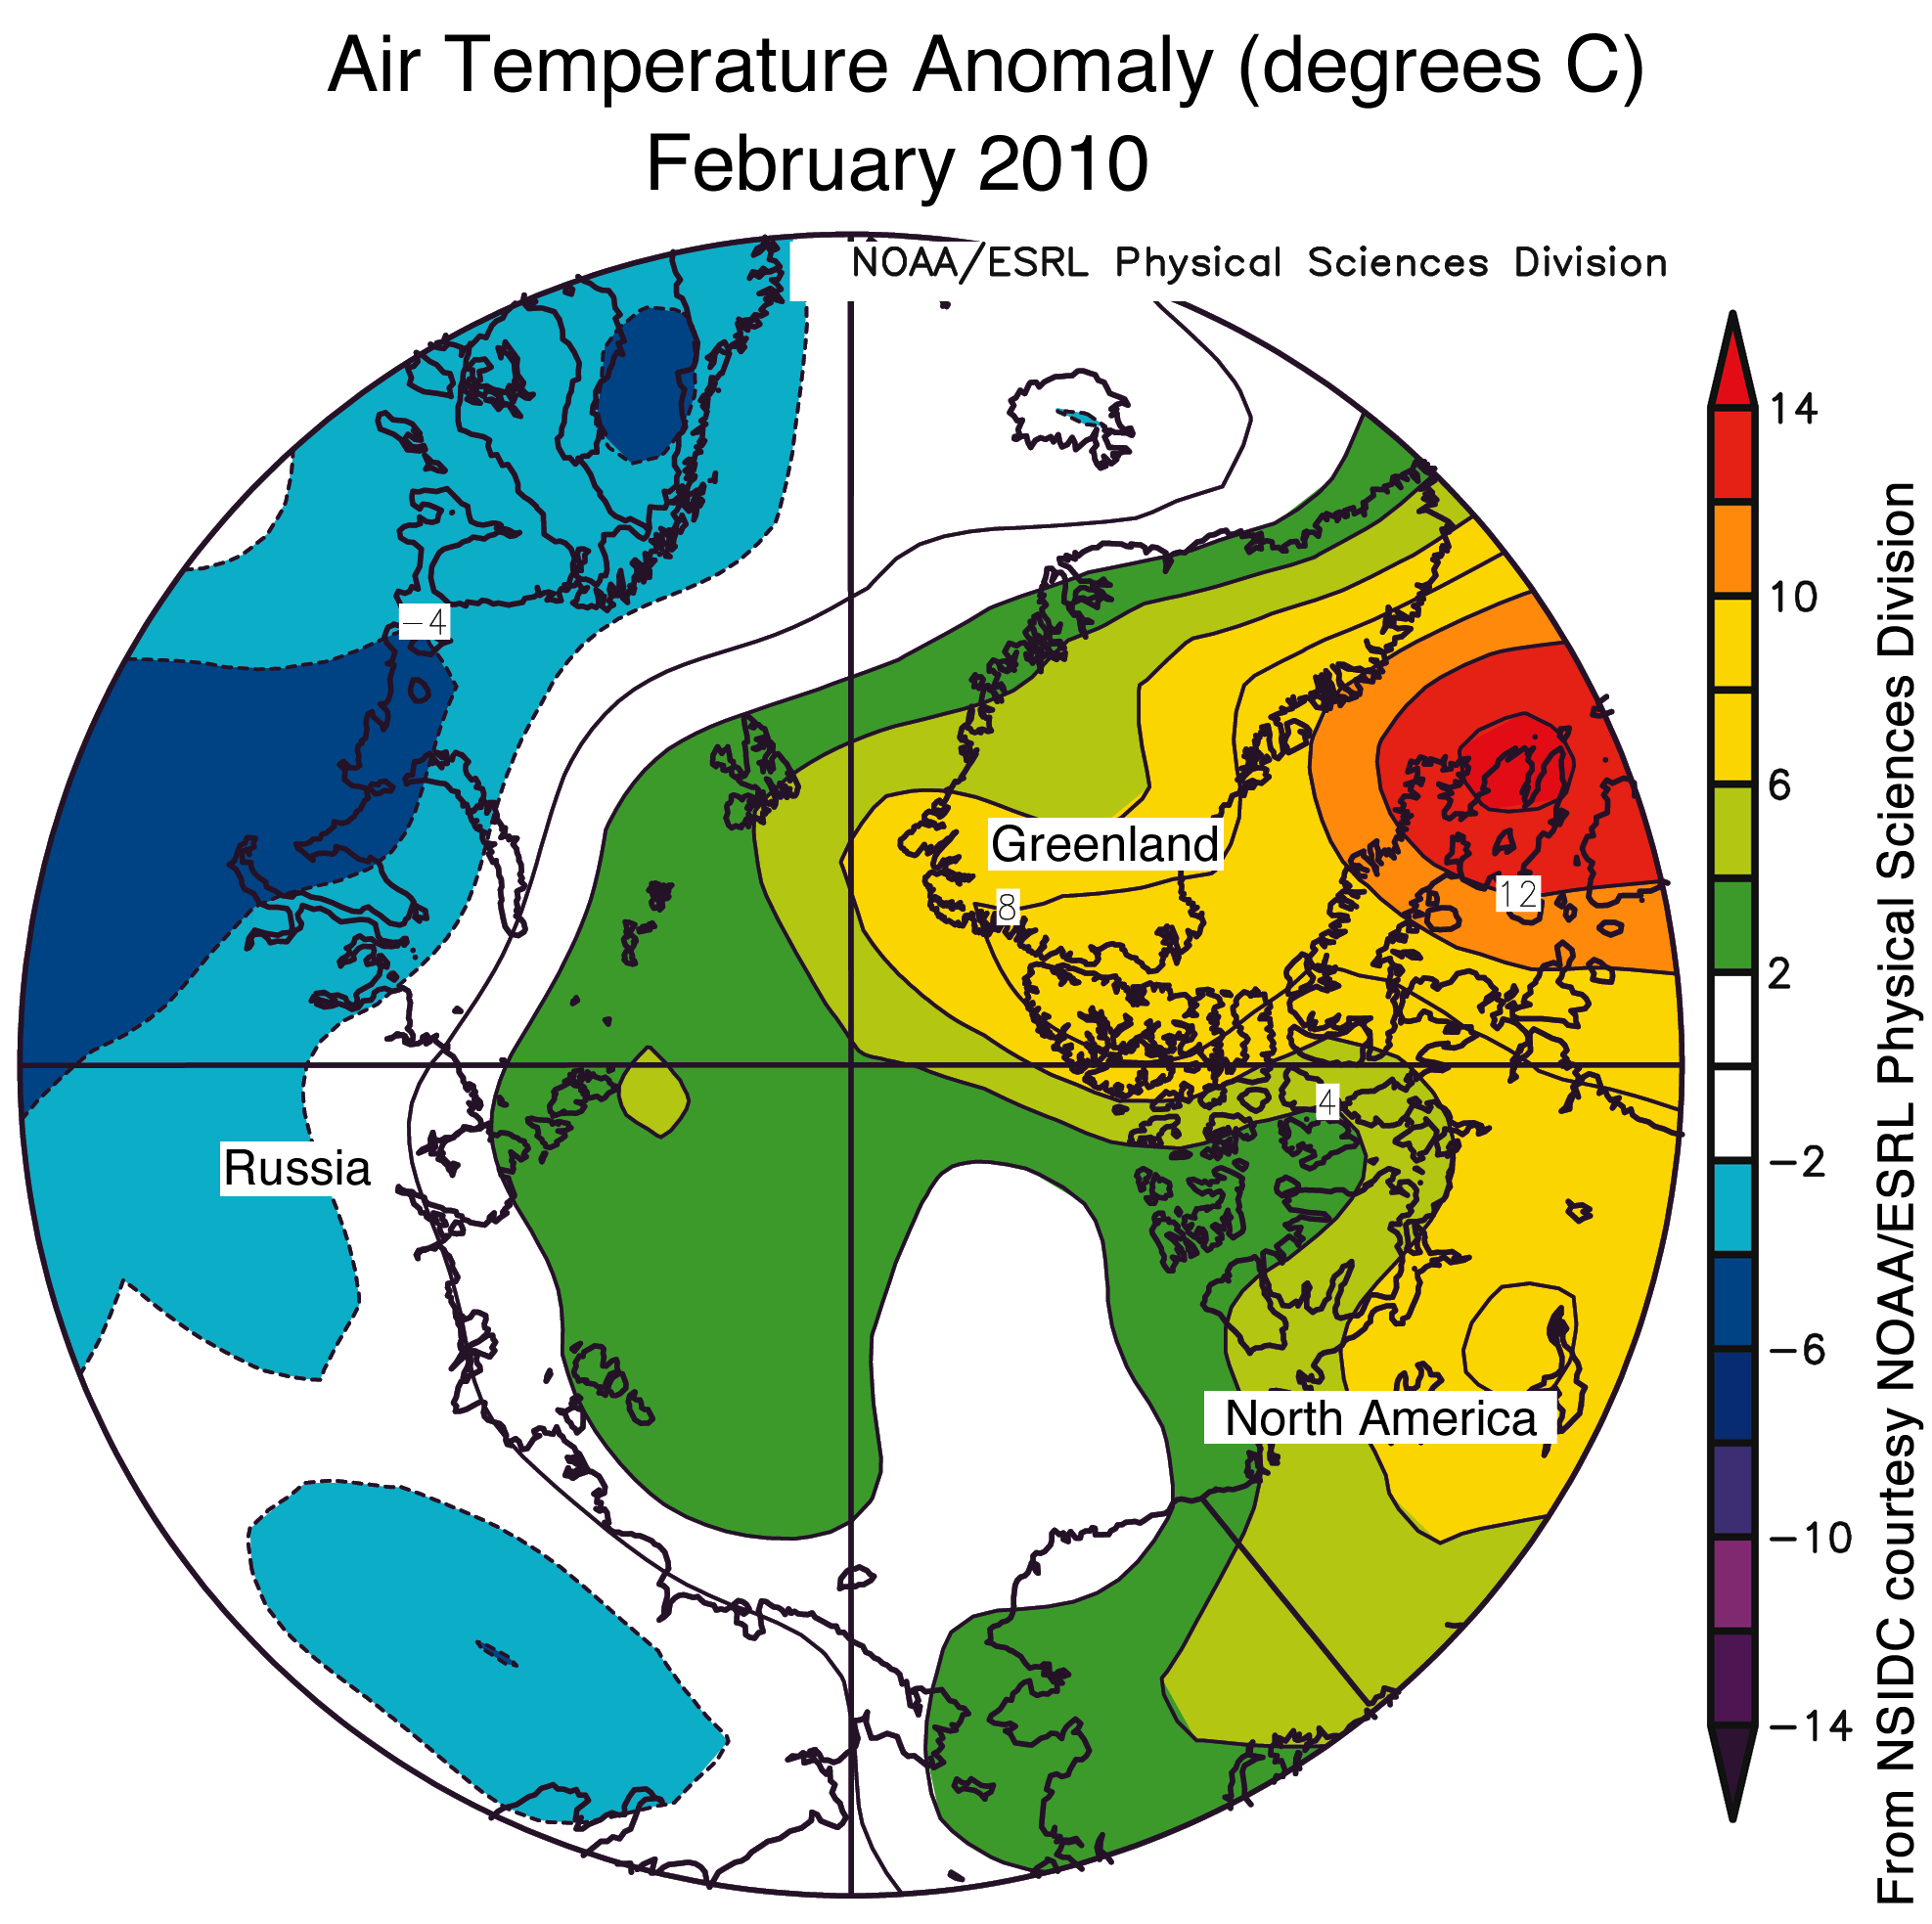 Figure 4. Map of air temperature anomalies for February 2010, at the 925 millibar level (roughly 1,000 meters or 3,000 feet above the surface) shows warmer than usual temperatures over the Arctic Ocean, with especially warm temperatures over Eastern Canada. Areas in orange and red correspond to strong positive (warm) anomalies. Areas in blue and purple correspond to negative (cool) anomalies.
 —Credit: National Snow and Ice Data Center courtesy NOAA/ESRL Physical Sciences Division
High-resolution image
Double-dip Arctic Oscillation
As noted previously, the Arctic Oscillation has been extremely negative this winter, with unusually high surface pressure over the Arctic Ocean. Following a strong negative phase from mid-December through mid-January, the AO briefly went positive, but then dipped again to a strongly negative phase. For more information on the Arctic Oscillation, see the NOAA Climate Prediction Center Web site.
The strong negative AO has contributed to cold temperatures throughout much of the U.S. and northern Europe, and the notable snow events in the eastern U.S. However, the impact on the Arctic has been quite different. First, a negative AO tends to bring warmer than normal temperatures to the Arctic. This factor contributed to the low ice conditions in the Atlantic side of the Arctic, discussed above. Second, the AO has a strong effect on Arctic sea ice motion. The pattern of winds associated with a strongly negative AO tends to reduce export of ice out of the Arctic through the Fram Strait. This helps keep more of the older, thicker ice within the Arctic. While little old ice remains, sequestering what is left may help keep the September extent from dropping as low as it did in the last few years. Much will depend on the weather patterns that set up this spring and summer.
[...]
No comments:
Post a Comment